Trucks Off Our Streets: Community Truck Counting & Air Quality Study
The Trucks Off Our Streets (TOOS) Coalition is a citywide alliance working to reduce residential truck traffic and industrial pollution in Detroit neighborhoods. TOOS empowers communities to:
- Conduct community-led truck counts and industrial monitoring
- Mobilize residents to participate in permit hearings
- Educate decision-makers on health impacts
- Advocate for truck route policies
TOOS Table Partners: Breath Free Detroit, Detroit Hispanic Development Corporation, Eastside Community Network, Hope Village Revitalization, Islamic Center of Detroit, Schoolcraft Improvement Association, Original United Citizens of Southwest Detroit (48217), The Villages Community Development.
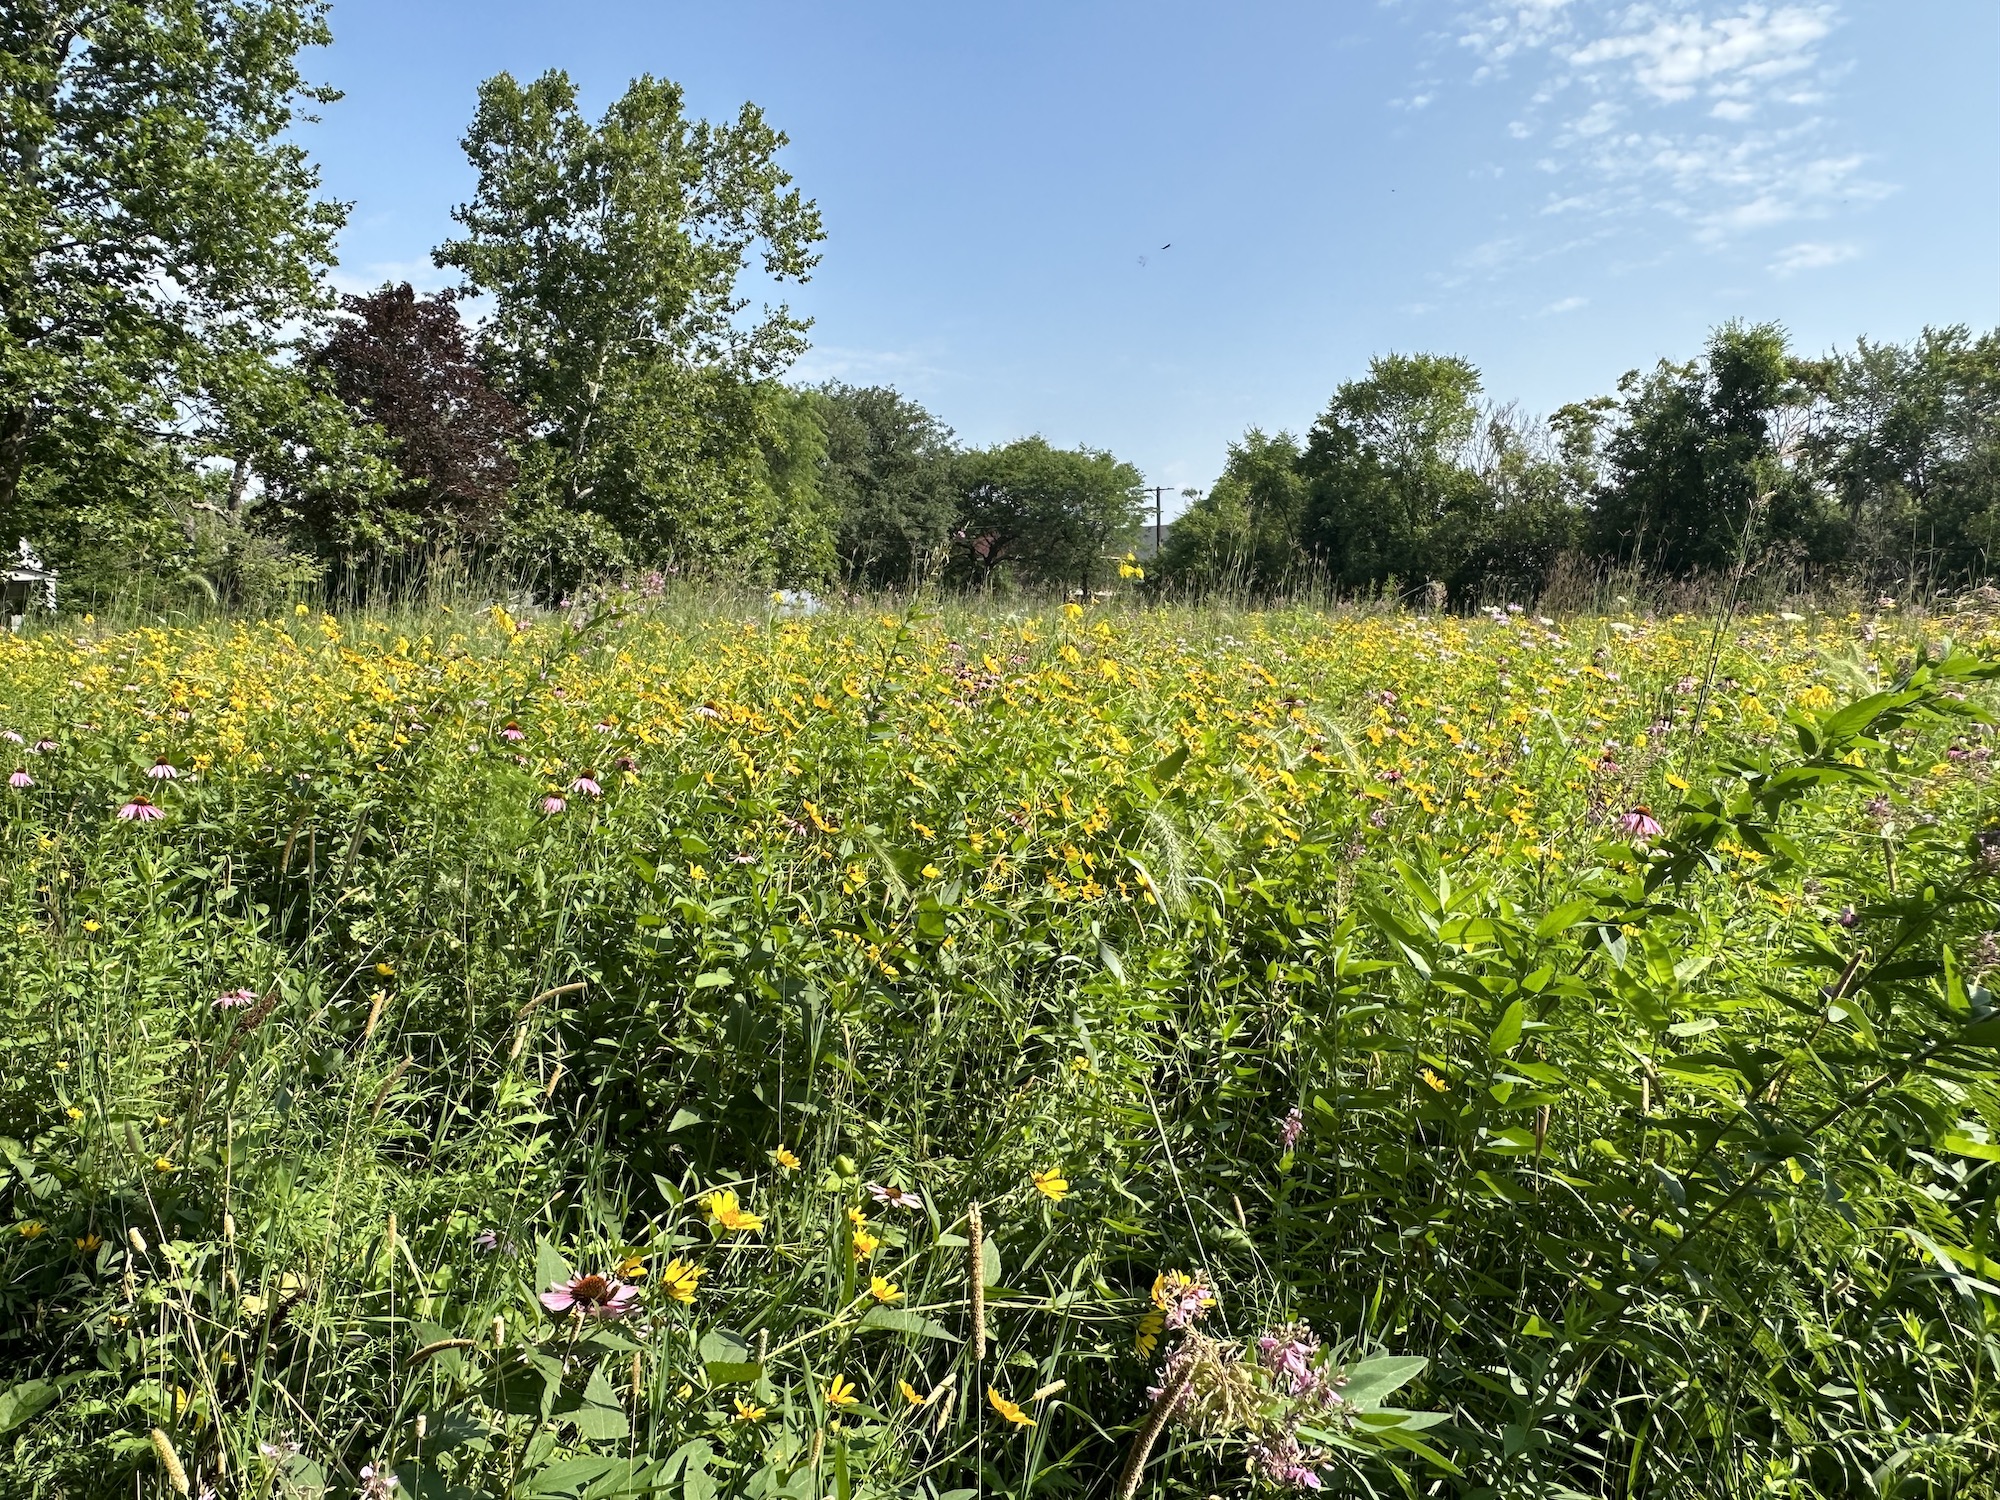
Study Location & Community Context
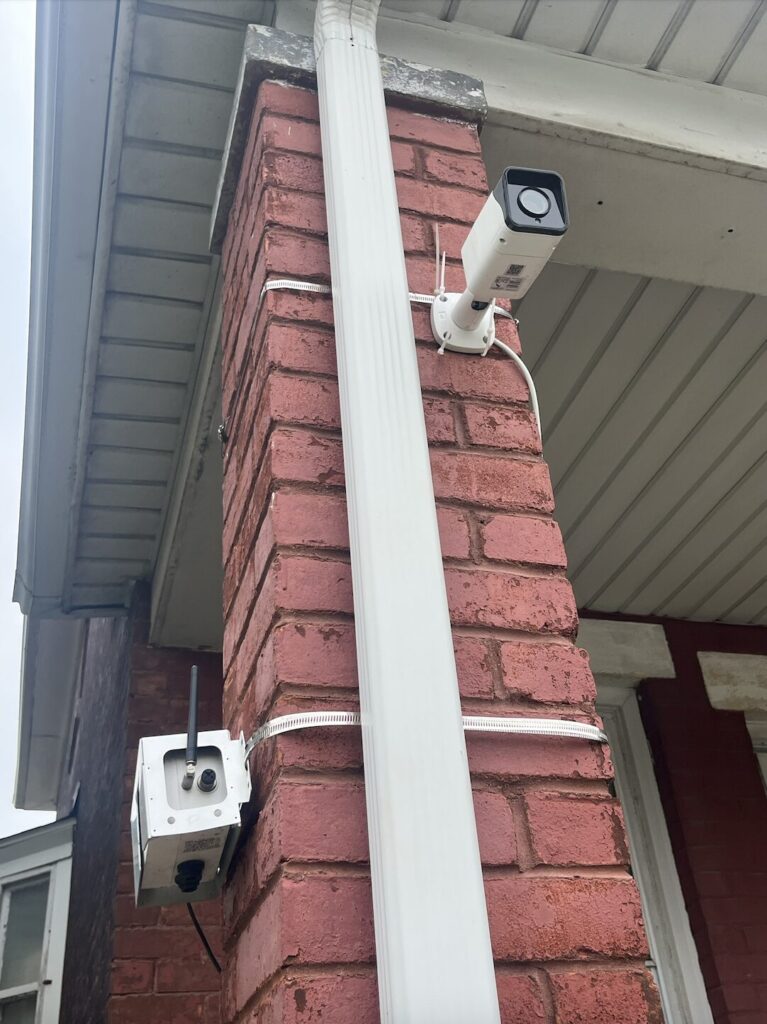
Monitoring Equipment
- Address: Residential location on Livernois, south of Vernor
- Setup: Porch-mounted camera and air quality monitor
- Power/WiFi: Residential source
Neighborhood Overview
- Population: ~8,200 residents
- Housing: Mix of older single-family homes and small apartment buildings
- Culture: Strong Latino presence, local businesses along Vernor Highway and Livernois Avenue
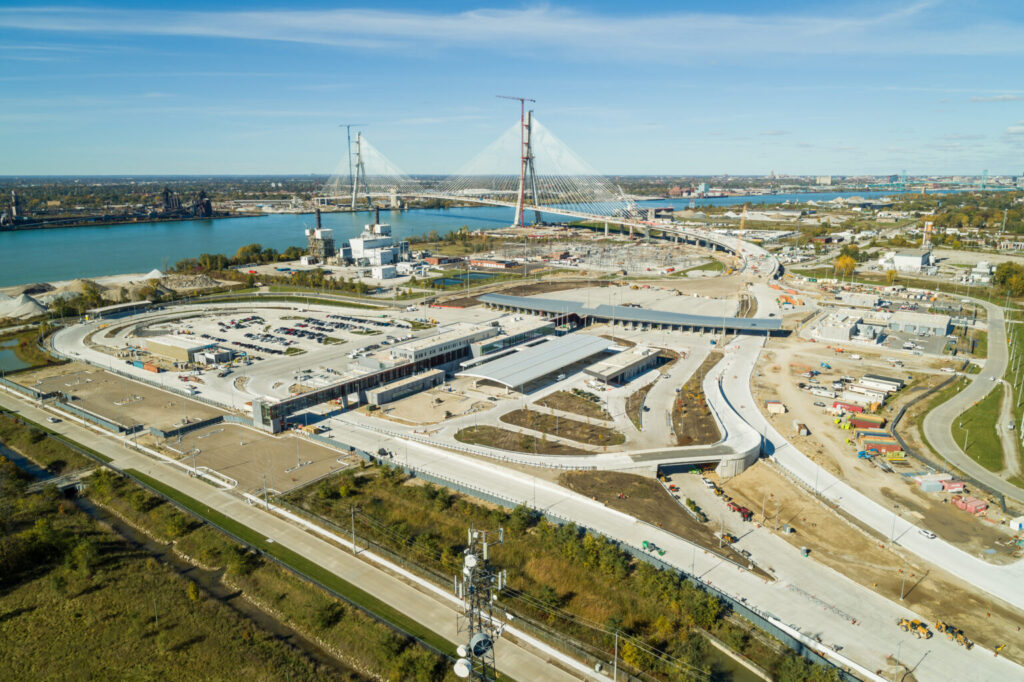
Nearby Locations
- Schools: Maybury Elementary (0.3 mi), Detroit Cristo Rey High (0.6 mi)
- Parks/Churches: Clark Park (0.5 mi), Most Holy Redeemer Church (0.1 mi)
- Highways: I-75 (0.4 mi), I-96 (0.7 mi)
- Industrial Sites: Detroit Intermodal Freight Terminal (0.5 mi), US Ecology (0.8 mi), Marathon Petroleum Refinery (1.0 mi), Fort Iron & Metal (1.3 mi)
Community Concerns
- Livernois and Dragoon Streets experience high truck traffic
- Historical complaints from residents about diesel trucks
- Feasible participation from a local resident for pilot study
Data Findings
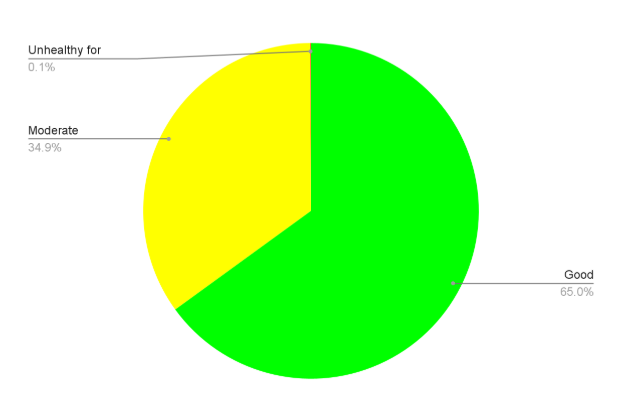
Air Quality & Truck Counts
- Over X air quality readings of PM2.5 collected
- X trucks counted passing the site
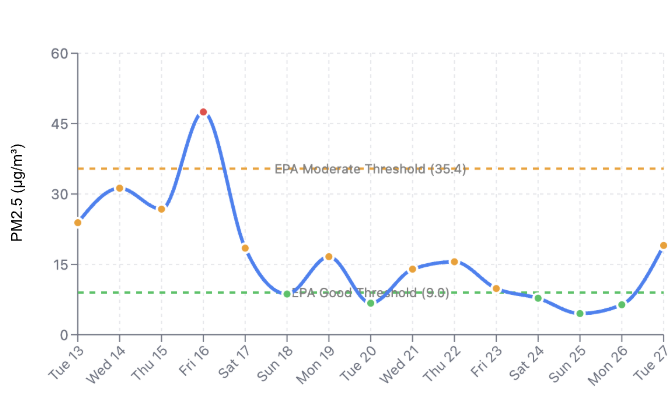
- Overall Air Quality: “Good” >80% of the time; average 8 µg/m³ (EPA “good” threshold: 9 µg/m³)
Key Observations:
- Spikes in PM2.5: Daily peaks exceeded “good” levels regularly
- Highest Peak: 47.48 µg/m³ on August 16 (unhealthy for sensitive groups)
- Truck Count vs Air Quality: High truck volumes did not always correspond to higher PM2.5
- Sept 5: 251 trucks, PM2.5 = 5.2 µg/m³
- Sept 12-13: PM2.5 = 16.8 & 18.6 µg/m³, low truck counts
Weekend Pattern: Lower truck counts and lower PM2.5 levels on weekends (Sept 6-7, 13-14)
Daily Timing: Most PM2.5 peaks occurred between 12–6 PM
Traffic Highlights
- Peak Traffic: Sept 9 – 271 trucks
- Lowest Traffic: Sept 14 – 38 trucks
- Weekday Average: 180–270 trucks
Recommendations
Immediate Behavioral Change
- Track daily air quality with local monitors
- Use air purifiers indoors, particularly in frequently used rooms
- Check air quality before outdoor activities
Environmental Change
- Advocate for urban planning that separates heavy truck routes from homes, schools, and parks
- Plant green infrastructure along busy truck routes to help mitigate pollution
Long-Term Structural Change
- Implement traffic management strategies (rerouting trucks, emission standards, truck restrictions)
- Develop a comprehensive air quality plan addressing local and regional pollution
- Expand monitoring and communication to provide residents with actionable health information